What is Frequency Spectrum?
Imagine a signal (like a sound or an electrical signal) as a mix of many different frequencies (or “vibrations” per second). Frequency Spectrum is a way to show how much of each frequency is present in the signal.
- Frequency is how fast something vibrates or repeats. It’s measured in Hertz (Hz), which is the number of vibrations per second.
- A Signal could be anything like sound, light, or a radio wave. These signals can be complex and contain many different frequencies, even if we only hear or see one thing.
What is Frequency Spectrum Analysis?
Frequency Spectrum Analysis is the process of breaking down a signal into its different frequency components and showing them in a graph. This helps us understand what frequencies are in the signal and how much of each frequency is present.
- Why do we do this? It helps us understand things like:
- What tones are in a piece of music or a sound recording?
- What types of radio waves are carrying information in a communication signal?
- What’s going on in a signal from a sensor or a machine?
Think of It Like a Music Band
Imagine you’re listening to a song. The song is a mix of many different instruments (like drums, guitar, vocals, etc.). Each instrument has its own frequency (or sound wave).
- Frequency Spectrum of the song is like a list of all the instruments in the band, telling you how much of each instrument is playing at different times.
- Spectrum Analysis breaks down the song into different notes (frequencies) and shows you which frequencies are strongest, which are weak, and how they change over time. This is similar to how you might analyze the sound of the drums, guitar, and vocals separately.
Key Concepts in Spectrum Analysis:
- Amplitude: This refers to the strength or loudness of the signal at each frequency. Higher amplitude means the signal at that frequency is stronger.
- In our music example, it would be like the loudness of the guitar, drums, or vocals.
- Frequency: This is how fast the signal is changing per second. For sound, low frequencies are like deep, slow sounds (like a bass drum), and high frequencies are fast and sharp sounds (like a violin).
- In music, the bass guitar plays low frequencies, while a high-pitched flute plays high frequencies.
- Range of Frequencies: Signals can have a wide range of frequencies. For example, a radio station transmits signals in a specific frequency range (like 88 MHz to 108 MHz), while human hearing can hear between 20 Hz to 20,000 Hz (20 kHz).
- Fourier Transform: To analyze the frequencies in a signal, we use a mathematical tool called the Fourier Transform. It converts a signal from its time domain (how the signal changes over time) to its frequency domain (how much of each frequency is present in the signal).
- It’s like taking a music recording and separating out the individual instruments or notes.
How Spectrum Analysis Works:
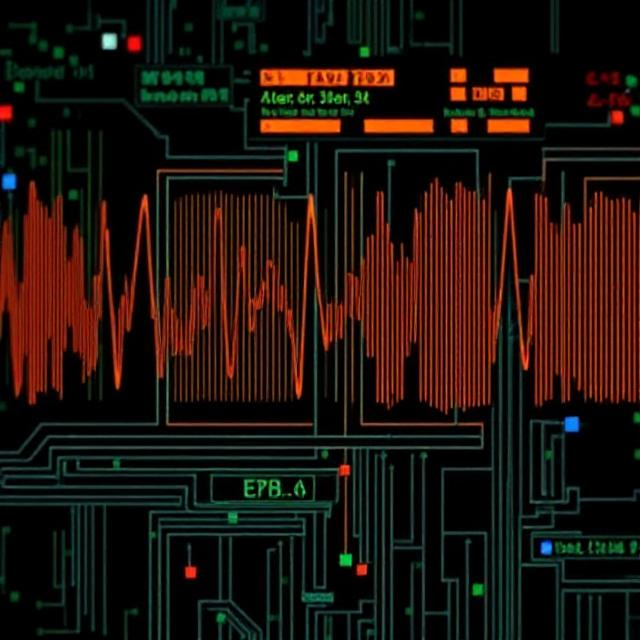
Let’s say you have a signal that looks like a wiggly line on a graph (a time-domain signal). If you do a frequency spectrum analysis on it, you will see a graph where:
- The x-axis represents the frequency (from low to high).
- The y-axis represents the amplitude (how strong each frequency is).
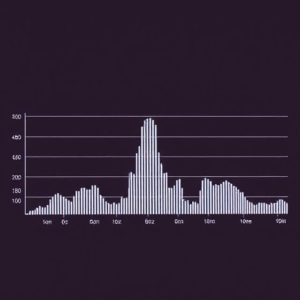
In this graph, you might see:
- Peaks at certain frequencies, which tell you that those frequencies are strong in the signal.
- Flat sections where there are no or very weak frequencies.
Real-Life Examples:
- Audio Signals: In audio recording or music, the frequency spectrum analysis helps us see all the different frequencies (bass, treble, vocals) in a song and understand how the sound is made up.
- You can use it to adjust the sound by increasing or decreasing certain frequencies (like boosting the bass).
- Radio Signals: When we listen to the radio, we tune into a specific frequency. Spectrum analysis helps us see what other signals (radio stations) are around the one we’re tuned to.
- This way, we can make sure there’s no interference from other stations.
- Communication: In communication systems (like Wi-Fi or cell phones), spectrum analysis is used to check the quality of the signal and see if any frequencies are overloaded or interfering with each other.
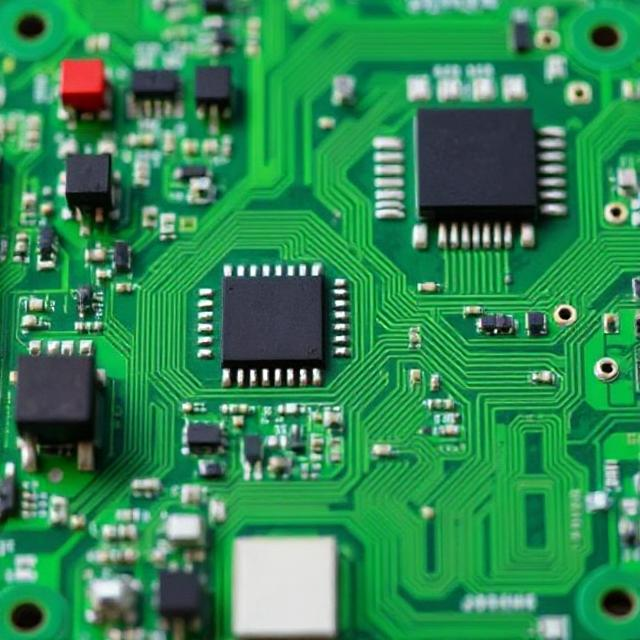
- Electrical Signals in Machines: Engineers use frequency spectrum analysis to check the health of machines by looking at vibrations or signals from the machine. If a certain frequency is too high or low, it might indicate a problem (like a malfunctioning motor).
In Short:
- Frequency Spectrum Analysis is like looking at a signal and figuring out what frequencies (or “waves”) are inside it and how strong each one is. It helps us understand and work with all kinds of signals, whether for sound, communication, or machinery.